|
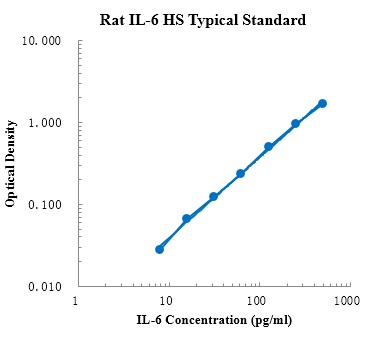
Rat IL-6 (Interleukin 6) ELISA Kit |
|
Sensitivity |
1.86 pg/mL |
|
Range |
7.81-500pg/mL |
|
Uniprot ID |
P20607 |
|
Detection Method |
Sandwich |
|
Standard |
500pg/mL |
|
Sample type |
Serum, Plasma, Tissue homogenate and Other biological samples;Sample Volume=100μL |
|
Reaction time |
3.5H |
|
Research Area |
Tumor immunity;Endocrinology;Hormone metabolism |
|
Alternative Names |
B-cell differentiation factor, B-cell stimulatory factor 2, BSF2, BSF-2, CDF, CTL differentiation factor , HSF, hybridoma growth factor, IFNB2, IFN-beta-2, IL6, IL-6, Interferon beta-2, interleukin 6 (interferon, beta 2), interleukin BSF-2, interleukin-6, MGI-2A |
|
Test Principle |
This ELISA kit uses the Sandwich-ELISA principle. The micro ELISA plate provided in this kit has been pre-coated with an antibody specific to Rat IL-6. Standards or samples are added to the micro ELISA plate wells and combined with the specific antibody. Then a biotinylated detection antibody specific for Rat IL-6 and Avidin-Horseradish Peroxidase (HRP) conjugate are added successively to each micro plate well and incubated. Free components are washed away. The substrate solution is added to each well. Only those wells that contain Rat IL-6, biotinylated detection antibody and Avidin-HRP conjugate will appear blue in color. The enzyme-substrate reaction is terminated by the addition of stop solution and the color turns yellow. The optical density (OD) is measured spectrophotometrically at a wavelength of 450 nm ± 2 nm. The OD value is proportional to the concentration of Rat IL-6. You can calculate the concentration of Rat IL-6 in the samples by comparing the OD of the samples to the standard curve. |
|
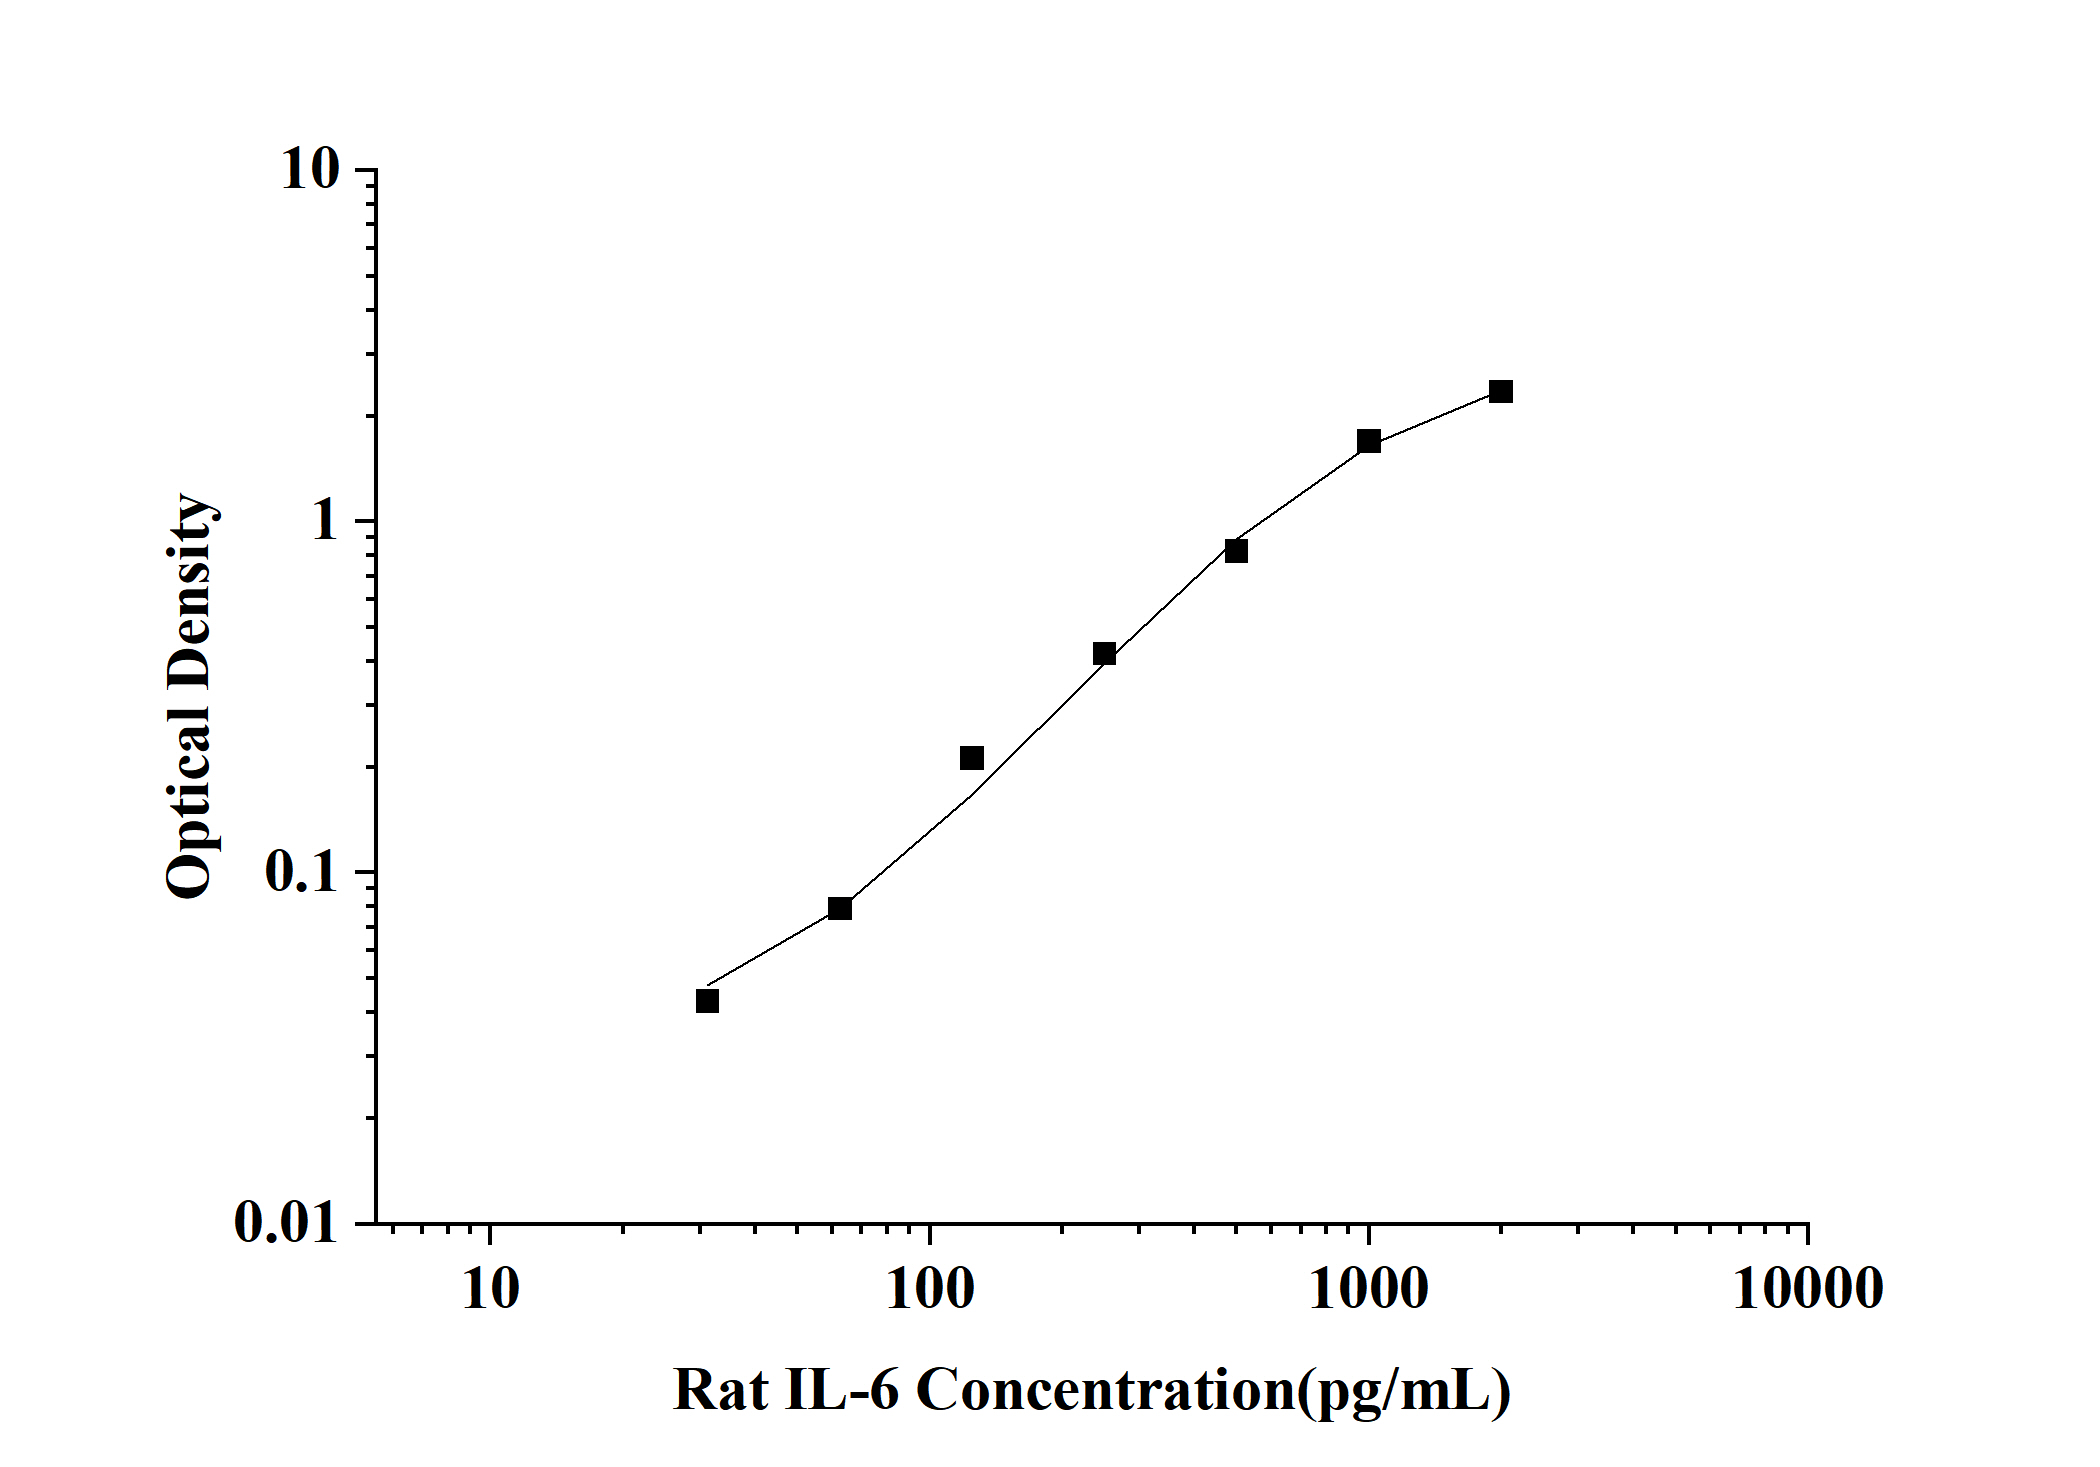
Rat IL-6 (Interleukin 6) ELISA Kit |
|
Sensitivity |
28.77 pg/mL |
|
Range |
31.25- 2000pg/mL |
|
Uniprot ID |
P20607 |
|
Detection Method |
Sandwich |
|
Sample type |
Serum, Plasma, Tissue homogenate and Other biological samples;Sample Volume=100μL |
|
Reaction time |
3.5H |
|
Research Area |
Tumor immunity;Endocrinology;Hormone metabolism |
|
Alternative Names |
IL-6;IL 6;IL6;Interleukin-6;Interleukin 6;Interleukin6;B-cell differentiation factor, B-cell stimulatory factor 2, BSF2, BSF-2, CDF, CTL differentiation factor , HSF, hybridoma growth factor, IFNB2, IFN-beta-2, IL6, IL-6, Interferon beta-2, interleukin 6 (interferon, beta 2), interleukin BSF-2, interleukin-6, MGI-2A;Hybridoma growth factor;Interferon beta-2;IFNB 2;IFNB-2;IFN-B2 |
|
Test Principle |
This ELISA kit uses the Sandwich-ELISA principle. The micro ELISA plate provided in this kit has been pre-coated with an antibody specific to Rat IL-6. Standards or samples are added to the micro ELISA plate wells and combined with the specific antibody. Then a biotinylated detection antibody specific for Rat IL-6 and Avidin-Horseradish Peroxidase (HRP) conjugate are added successively to each micro plate well and incubated. Free components are washed away. The substrate solution is added to each well. Only those wells that contain Rat IL-6, biotinylated detection antibody and Avidin-HRP conjugate will appear blue in color. The enzyme-substrate reaction is terminated by the addition of stop solution and the color turns yellow. The optical density (OD) is measured spectrophotometrically at a wavelength of 450 nm ± 2 nm. The OD value is proportional to the concentration of Rat IL-6. You can calculate the concentration of Rat IL-6 in the samples by comparing the OD of the samples to the standard curve. |
|
Rat IL-6 (Interleukin 6) ELISA Kit |
|
Sensitivity |
1.8 pg/mL |
|
Range |
7.81pg/mL-500pg/mL |
|
Detection Method |
Sandwich |
|
Sample type |
Serum, Plasma, Tissue homogenate and Other biological samples;Sample Volume=100μL |
|
Storage |
stored at 4℃. However, if it has been opened, the standard solution should be stored at -20℃, while the other components should be stored at 4℃. |
|
Test Principle |
This kit utilizes the double antibody sandwich enzyme-linked immunosorbent assay (ELISA) detection technique. Specific anti-rat IL-6 antibodies are precoated on a high-affinity ELISA plate. Standards and test samples are added to the wells of the ELISA plate. After incubation, the IL-6 present in the samples binds to the solid-phase antibodies. After washing to remove unbound substances, biotinylated detection antibodies are added and incubated. After washing to remove unbound biotinylated antibodies, streptavidin-HRP labeled with horseradish peroxidase is added. After washing again, a signal enhancer is added and incubated. After washing to remove unbound substances, Streptavidin-HRP is added once more. After washing, a colorimetric substrate, TMB, is added and the plate is incubated in the dark for color development. The intensity of the color reaction is directly proportional to the concentration of IL-6 in the samples. A stop solution is added to terminate the reaction, and the absorbance value is measured at a wavelength of 450 nm (with a reference wavelength range of 570-630 nm). |
|
Rat IL-6 (Interleukin 6) ELISA Kit |
|
Sensitivity |
1.5 ng/L |
|
Range |
8 ng/L-150 ng/L |
|
Detection Method |
Sandwich-ELISA |
|
Sample type |
Serum, Plasma, Tissue homogenate and Other biological samples;Sample Volume=100μL |
|
Alternative Names |
Rat Corticosterone (CORT) ELISA Kit |
|
Test Principle |
This ELISA kit uses Sandwich-ELISA as the method. The Microelisa stripplate provided in this kit has been pre-coated with an antibody specific to IL-6. Standards or samples are added to the appropriate Microelisa stripplate wells and combined to the specific antibody. Then a Horseradish Peroxidase (HRP)- conjugated antibody specific for IL-6 is added to each Microelisa stripplate well and incubated. Free components are washed away. The TMB substrate solution is added to each well. Only those wells that contain IL-6 and HRP conjugated IL-6 antibody will appear blue in color and then turn yellow after the addition of the stop solution. The optical density (OD) is measured spectrophotometrically at a wavelength of 450 nm. The OD value is proportional to the concentration of IL-6. You can calculate the concentration of IL-6 in the samples by comparing the OD of the samples to the standard curve. |